Automotive Digital Marketing Performance Trends – April
We’re closely monitoring website traffic and paid search trends for auto dealerships. Check back weekly for updates, data, and insights.
Insights published April 27, 2020
The insights below were published on 4/27/20. Please check back for weekly updates. To get relevant industry performance metrics and helpful resources during this time, please visit our resource hub or subscribe below.
WEBSITE PERFORMANCE TRENDS
As we head into the end of the month, we’re happy to report that the positive trends we saw last week continued over the past 7 days. Website traffic for car dealerships is increasing, although we have observed the rate of rebound slow over the past 7 days. As you can see in the graph below, overall website traffic has seen an increase of (+25.2%) in the last 14 days and (+2.9%) in the last 7 days, while traffic is down (-6.5%) over the last 30 days.

Organic traffic is showing the greatest gains, with increases of (+4.6%) in the last 7 days, (+33.0%) in the last 14 days, and (+2.4%) in the last 30 days.

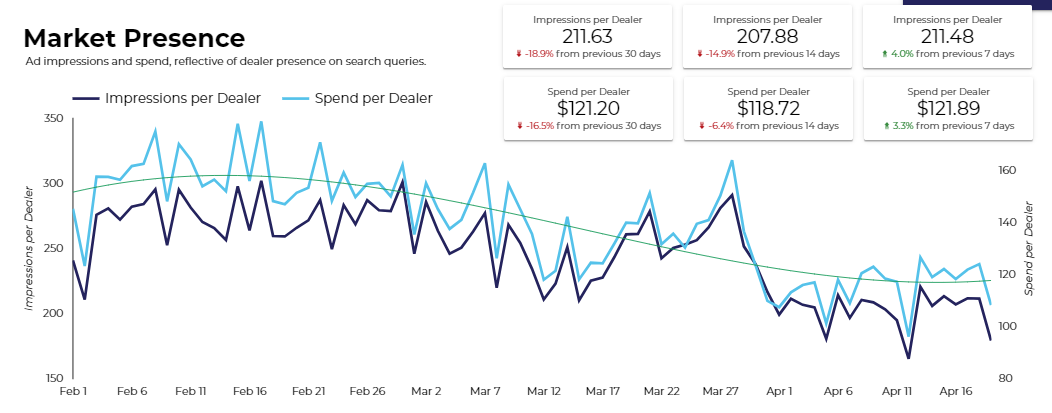
DIGITAL ADVERTISING – PAID SEARCH TRENDS
Paid traffic saw an increase of (+10.1%) in the last 14 days, but is down (-3.0%) in the last 7 days when compared to the previous period. Focusing in more on paid search traffic and trends, average spend is down (-16.3%) and impressions per dealer are down (-18.7%) over the last 30 days compared to the previous period.

As dealers begin to reenter the market, market share has started to decline. Average dealer market share is down (-4.7%) over the last 14 days.

Lead action rate per dealer has remained relatively consistent and has only deviated by (+0.09%) when comparing the last 7 and 30 days.

As expected, store visits have seen a significant decline and are down (-42.5%) over the last 30 days. However, online engagement is showing positive signs for dealers who are advertising. CTR is up (+19.9%) and CPC is down (-12.3%) over the last 30 days when compared to the previous period.
GOOGLE TRENDS
The good news continues for both dealer and model terms in Google Trends:
Insights published April 20, 2020
The insights below were published on 4/20/20. Please check back for weekly updates. To get relevant industry performance metrics and helpful resources during this time, please visit our resource hub or subscribe below.
WEBSITE PERFORMANCE TRENDS
We are happy to report that website traffic is coming back. Website sessions are down (-15.4%) in the last 30 days compared to the previous period, but as you can see below, we’re seeing almost all channels increase daily. Website sessions are up (+9.9%) in the last 14 days and (+16.8%) in the last 7 days. In fact, Friday, April 17 and Saturday, April 18 saw the highest average session count per dealer since February.


Looking at the last 7 days, overall dealer website traffic has increased by (+16.8%) compared to the previous period. Organic (+20.8%), Direct (+19.5%), Paid (+6.8%), Referral (+13.1%), Social (+27.8%), and Email (+14.7%) are all up over the last week as well. This tells us that users are returning to Google and dealer websites, and seems to hint that we’re starting to see the upswing of traffic getting back to normal.

DIGITAL ADVERTISING – PAID SEARCH TRENDS
Looking at paid search traffic and trends, average spend per dealer is up (+3.3%) in the past 7 days compared to the previous period.
Search impression share remains strong among dealers who are using digital advertising to take advantage of the recent increase in searches. Impression share is up (+9.0%) in the last 30 days.

Lead action rates are down (-10.1%) over the last 30 days, but the last two weeks have shown positive signs as lead action rates increased (+9.8%) over the last 14 days compared to the previous period. On another positive note, CTR continues to soar and has shown increases of (+5.4%) in the last 7 days and (+18.5%) in the last 14 days.

GOOGLE TRENDS
The good news continues for both dealer and model terms in Google Trends:
Insights published April 13, 2020
The insights below were published on 4/13/20. Please check back for weekly updates. To get relevant industry performance metrics and helpful resources during this time, please visit our resource hub or subscribe below.
WEBSITE PERFORMANCE TRENDS
Continuing what we saw last week, website traffic is down (-18.8%) in the last 30 days compared to the previous period.

Comparing the last two weeks to the previous period, website traffic is down (-9.8%) over the last 14 days, while organic traffic is up (3.8%). This is a sign that users are returning to search engines like Google and Bing to search for auto dealer terms.

Looking at just the last 7 days, there are more positive signs that users are starting their shopping journeys again. Total website traffic is up (+7.9%) over the last 7 days compared to the previous period. All traffic sources aside from display and other have seen an increase.
Here are some of the notable increases:
- Organic (+11.4%)
- Paid (+2.2%)
- Direct (+5.9%)
- Referral (+8.5%)
- Social (+18.5%)
- Email (+25.3%)

DIGITAL ADVERTISING – PAID SEARCH TRENDS
Dealers may be looking to capture this interest as the average spend per dealer is up (+4.2%) in the past 7 days.

Digital market share is also up. Comparing each time frame to the previous period, we’re seeing a (+7.0%) increase over the last 30 days, (+0.8%) over the last 14 days, and (+6.1%) over the last 7 days.

Lead action rates have also seen an increase. Comparing the last 14 days to the previous period shows a (2.2%) increase, while the last 7 days shows a (+0.9%) increase. CTR has increased in the last 14 and 7 days vs. previous periods as well, (+15.2%) and (+3.0%) respectively.

Insights published April 6, 2020
The insights below were published on 4/6/20. Please check back for weekly updates. To get relevant industry performance metrics and helpful resources during this time, please visit our resource hub or subscribe below.
WEBSITE PERFORMANCE TRENDS
Overall, you can see that website traffic has declined in the back half of Q1. Despite the slight increases we saw in both traffic and engagement at the end of March, the first week of April saw a decrease in sessions and pageviews for auto dealers. The dips are not uncharacteristic compared to previous drops in Q1, but we’ll continue to closely monitor the trendline as we move into Q2.

Over the past 30 days, traffic across channels has dropped (-17.2%) compared to the previous period. Organic traffic has taken the biggest hit of all channels and is down (-21.6%) over the last 30 days.

Looking at the past week, website traffic is down (-11.6%) compared to the week prior. Website sessions from email are up (+1.0%) which could be a positive as dealers use email to communicate inventory updates, news, and updates to customers.

DIGITAL ADVERTISING – PAID SEARCH TRENDS
Impressions (-10.3%) and ad spend (-14.6%) have gone down over the last week. We saw a brief increase in spend and impressions at the end of March as searches for low-funnel terms spiked online; however, the start of April has slowed slightly.

The average dealer has seen an increase in search impression share (+5.8%)over the past 30 days. This is a win for dealers who are expanding their digital advertising efforts to capture additional market share. Additionally, over the past 7 days we have observed that cost-per-click (CPC) has dropped (-9.1%) while click-through-rate (CTR) for the average dealer is up (+12.9%). It appears that dealers who maintain their digital advertising efforts right now can efficiently expand their market share and capture low-funnel users while paying a lower CPC.

The lead action rate for the average dealer is down (-14.3%) over the past 30 days. This aligns with the slight decrease in traffic noted above, but it’s important to note that there is a 30 day conversion window that’s still accruing conversions.

As expected, store visits are down (-8.9%) compared to the previous 30 days. Again, there is a 30 day conversion window that’s still accruing conversions, but we are monitoring this data closely and expect there to be a lull during this time as customers observe stay-at-home orders.

GOOGLE TRENDS
To understand how search behavior may be changing, use the following links to review common search terms in Google Trends:
About the Author
Adpearance is the digital marketing company obsessed with generating quality leads. Our solutions combine cutting-edge technology, premium tracking, and an expert team to transform business results.
Follow Us
Subscribe to our newsletter
Come on... You know you want to.
Related Posts
Subscribe to our newsletter
Get monthly newsletters with timely blogs and occasionally announcements for resources including in-depth reports, data-driven insights, and webinars.