Heavy Equipment Digital Marketing Performance Trends – April
We’re closely monitoring website traffic and paid search trends for heavy equipment dealerships. Check back weekly for updates, data, and insights.
Insights published April 27, 2020
The insights below were published on 4/27/20. Please check back for weekly updates. For access to helpful resources during this time, please visit our resource hub or subscribe below.
In the past week, we’ve witnessed the shift in media coverage regarding the next stage of dealing with the Coronavirus pandemic in the USA. As regulations change at both the federal and state level, geography is starting to play a huge role in how businesses are faring. Understanding your unique situation and adapting your decision making and strategies accordingly is key.
Adpearance is here to support this exact need. If you’re interested in talking 1:1 with an expert about your digital strategy, please contact us.
We are seeing consistent results for metrics measuring research and browsing online, while there are conflicting results for metrics that measure online action. We believe that these shifting regulations are causing customers shopping for equipment to be non-committal at this point.
WEBSITE PERFORMANCE TRENDS
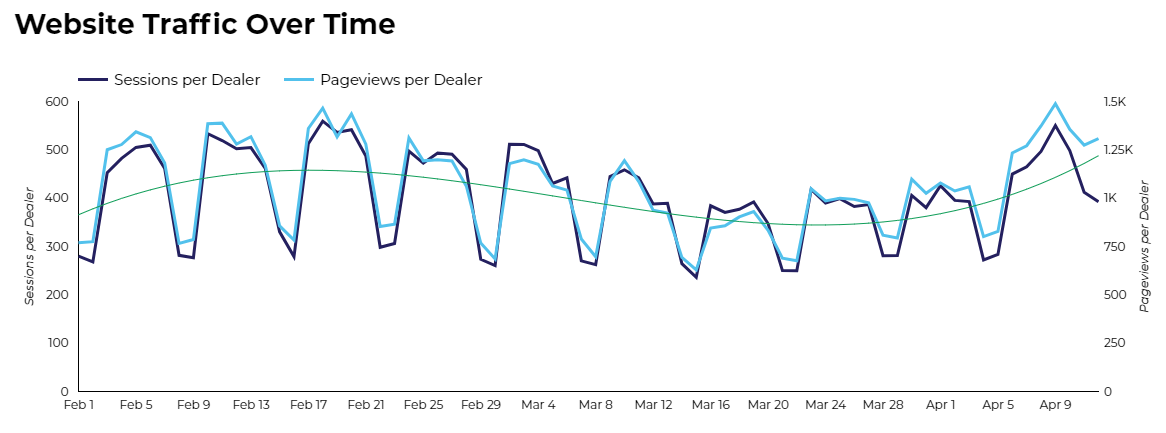
Overall, you can see that website traffic has continued its very positive upswing. On April 22, we saw the highest average sessions per dealer (914) so far this year. This is about 200 more sessions on average than the previous high on April 15.
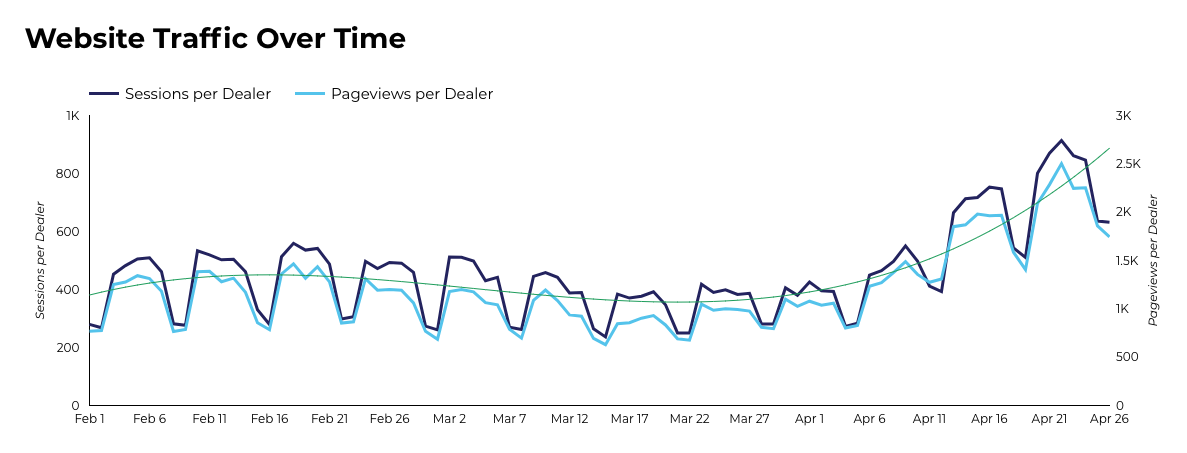
Over the past 30 days, website sessions have increased (+47.7%) compared to the previous period. Also, there have been over 2x the number of pageviews than sessions per dealer. Not only are more people shopping, but they are spending a greater amount of time researching and reviewing your inventory and services online.
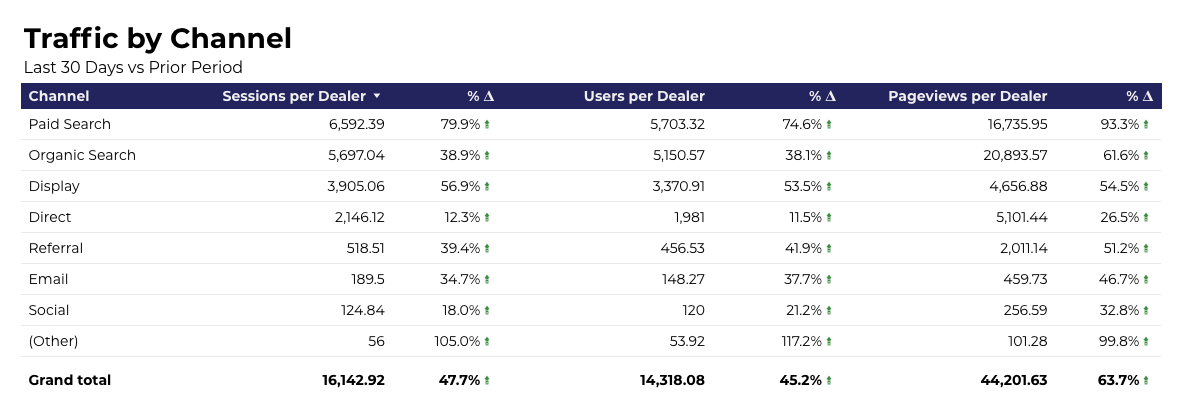
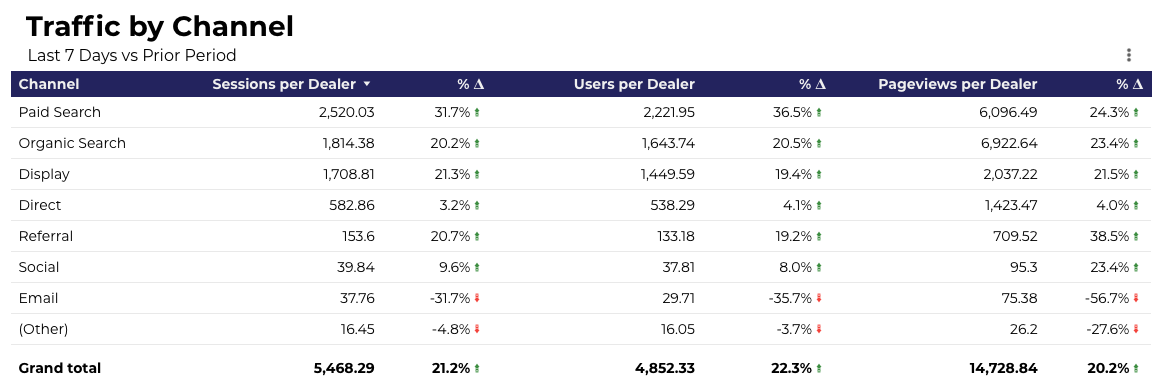
Looking more recently, we’ve seen an increase in traffic over the last 7 days of (+21.1%). In fact, all channels have seen increases in average dealer sessions, users, and pageviews over the past 7 days except for email, which has seen a decrease in avg. sessions (-31.3%), a decrease in avg. users (-32.8%), and a decrease in pageviews (-57.3%). However, given the incredible upswings we’ve seen over the past two weeks with regards to the email, this rate of settling is to be expected.
DIGITAL ADVERTISING TRENDS
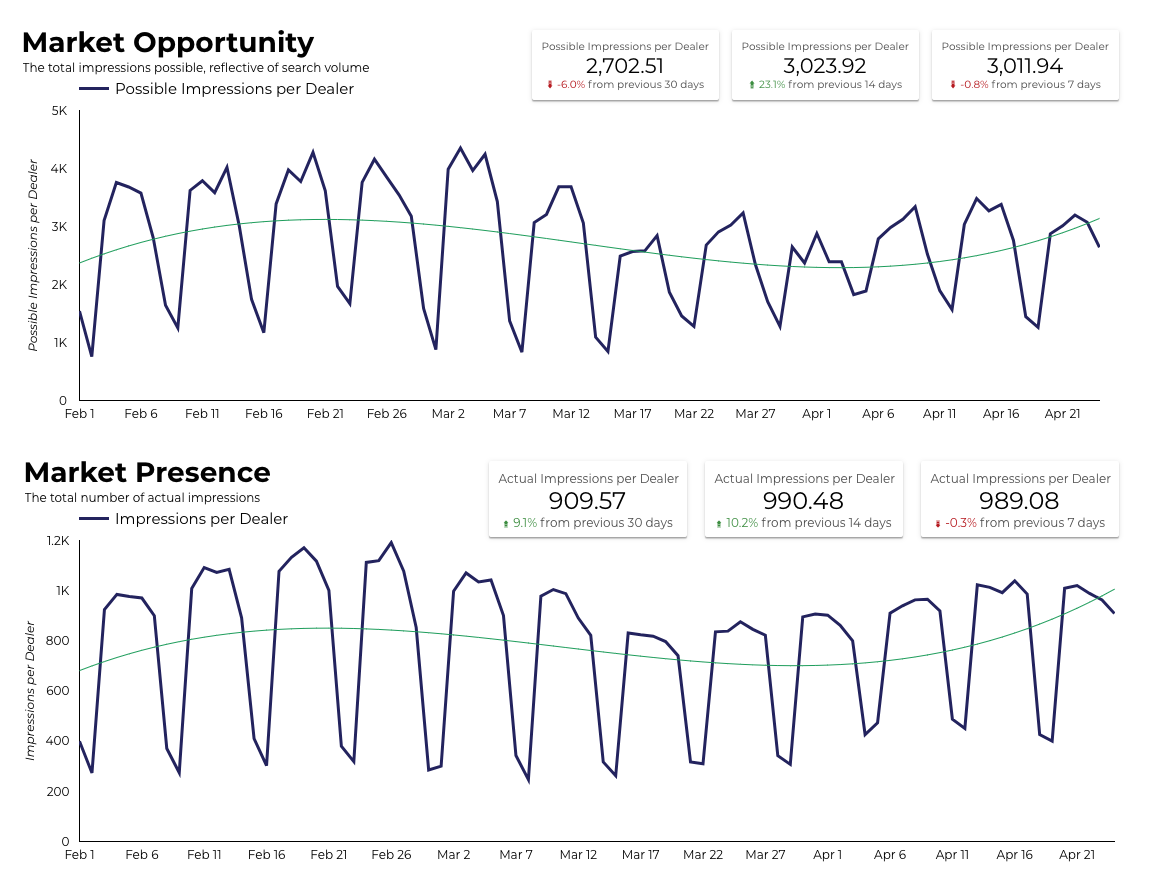
While website performance is continuing to see heavily positive trends, the performance for digital advertising is mixed.
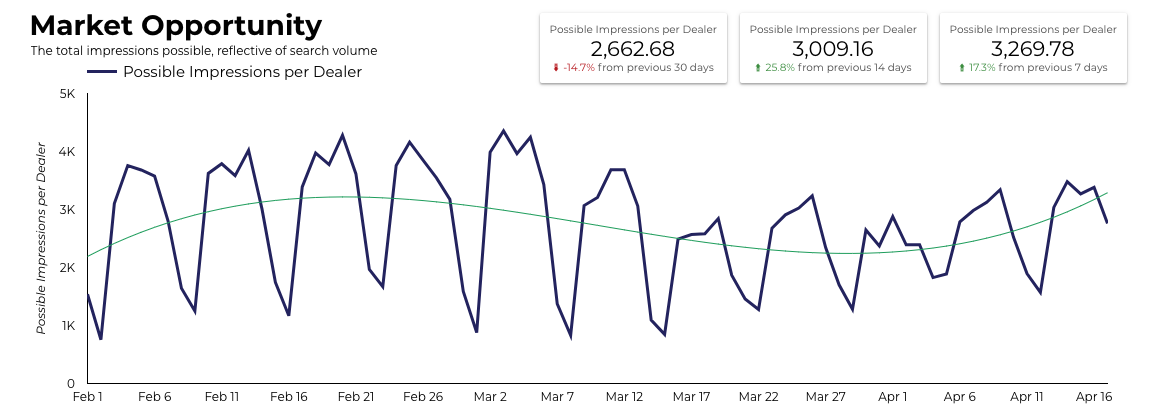
Averages for both possible impressions and actual impressions have steadied in the past week. Average dealer possible impressions are down (-3.1%) from the previous 7 days, but up (+22.6%) over the last 14 days. While average dealer actual impressions are down (-1.6%) from the past 7 days, but up (+ 10.0%) over the past 14 days. While overall impressions, possible and actual, are down from their February levels, we’re back to seeing the week-over-week fluctuations we regularly see in the market.
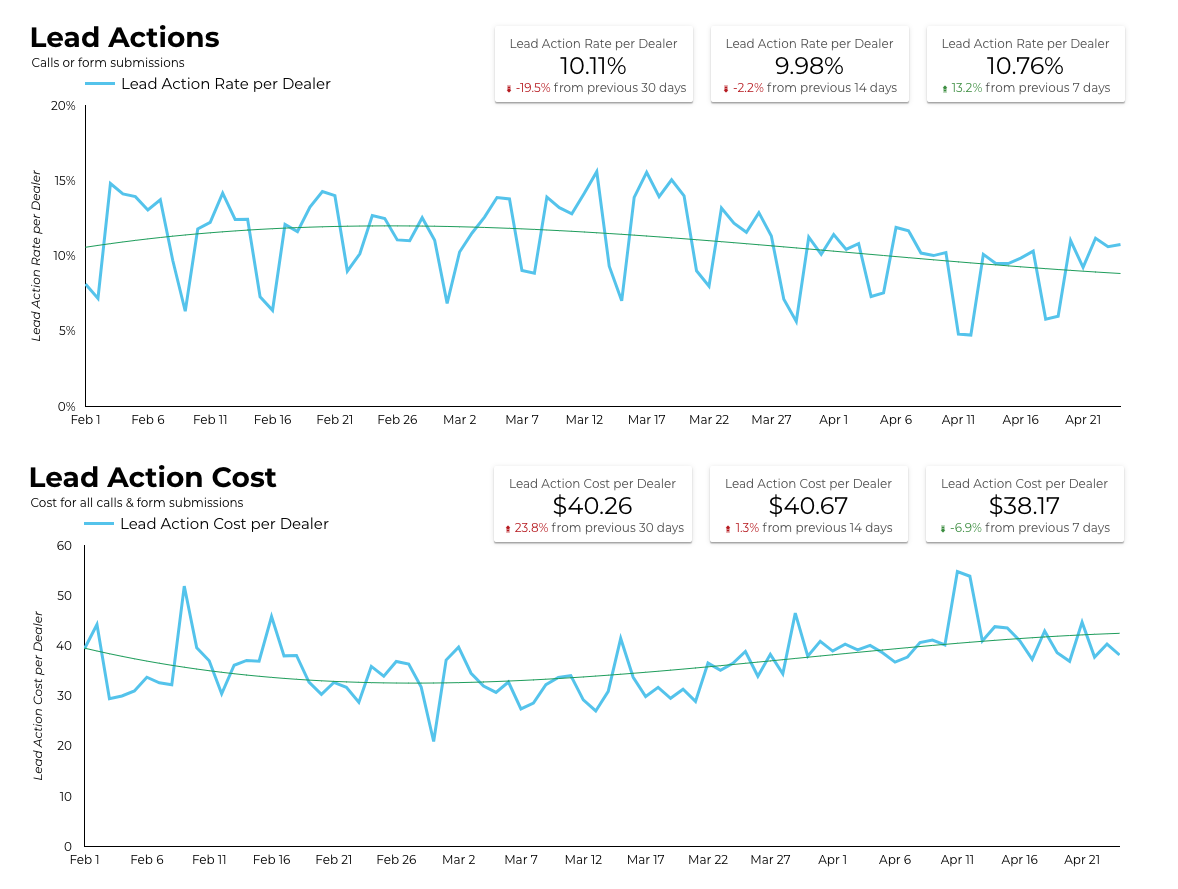
Following the high website performance we saw on April 22, this day also saw the highest average dealer conversion rate (11.18%) since April 7. Additionally, the average dealer lead action rate and cost per lead action finally shook their negative spiral. In the past seven days, the average dealer lead action rate is up (+12.5%) and the average dealer cost per lead action is down (-10.6%). One interesting note is that while these lead action KPIs seem to finally bring positivity, the average dealer CTR being down (-2.1%) over the past 7 days, slightly tempers the overall trend.
Insights published April 20, 2020
The insights below were published on 4/20/20. Please check back for weekly updates. To get relevant industry performance metrics and helpful resources during this time, please visit our resource hub or subscribe below.
WEBSITE PERFORMANCE TRENDS
As companies adapt to what it means to do business right now, the equipment industry is leaning in with a vengeance. While it’s too soon to call this the ‘new normal’, record high website performance has us optimistic. As industries start to understand how to get things done within the confines and regulations necessary for health and safety, we are interested to investigate new benchmarks for website and digital advertising performance.
Over the last 30 days, all major channels have seen increases in sessions, users, and pageviews, with April 15th seeing the highest average daily sessions per dealer (717.2) so far this year.

Over the past 7 days, average paid (+42.7%) and organic (+23.9%) pageviews per dealer have increased. Additionally, display sessions (+162.4%), users (+156.7%), and pageviews (+159.2%) are way up. While our assumption has been that website traffic would go up due to stay-at-home regulations, the size of these increases are staggering. Not only are people finding you across channels, but they are spending time researching and shopping for inventory online. Having accurate business and inventory information available to your shoppers both on- and off-site has never been more critical.

DIGITAL ADVERTISING TRENDS
Following this positive thread, digital advertising metrics are looking up this week. Your market is alive again, with average dealer possible impressions up (+13.1%) over the past 7 days and up even more significantly (+24.7%) over the past two weeks. In fact, April 14th saw the highest number of possible impressions (3,381) in over a month (since March 12th, which saw 3,686 possible impressions).
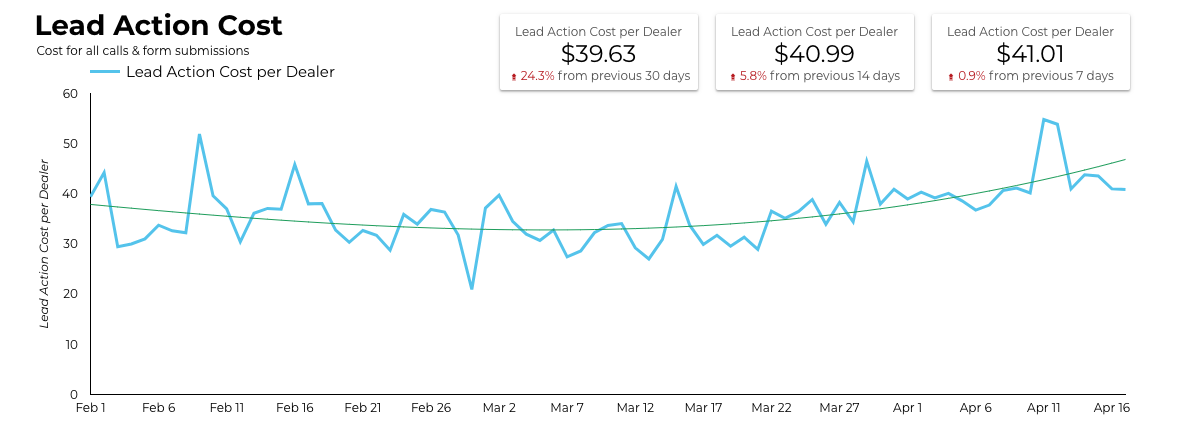
While average dealer lead action cost is up (+22.1%) over the past 30 days, the lead action cost has mostly steadied in the last 14 days.
Lastly, for the first time in almost four weeks, average dealer CPC is down (-5.4%) and average dealer CTR is up (+12.6%) over the past 7 days. But, the lead action rate for the average dealer is at 9.5%, down (-6.8%) over the last 7 days. While we’ve been watching this metric closely for signs of a trend towards research versus action from customers, this week’s metrics have given us mixed signals.

GOOGLE TRENDS
To understand how search behavior is adjusting, use the following links to review common search terms in Google Trends:
- Google Trends – Tractors & UTVs
- Google Trends – Compact/Utility Tractors
- Google Trends – Forklifts/Lift Trucks
- Google Trends – Excavators/loaders
Insights published April 13, 2020
The insights below were published on 4/13/20. Please check back for weekly updates. To get relevant industry performance metrics and helpful resources during this time, please visit our resource hub or subscribe below.
WEBSITE PERFORMANCE TRENDS
This week our data is showing some very positive signs. Overall website traffic has clearly improved, a good sign towards recovery in the market. In fact, April 9th saw the highest average dealer sessions (550.45) since February 18th (559.31). While we will continue to monitor closely, this result has us optimistic that the industry is starting to normalize and reset across the globe.
That said, let’s zoom in. Currently, website sessions are still slightly down (-12.3%) over the last 30 days compared to the previous period, but that negative percentage has declined since we reported last week. And, while all traffic channels are down again this week, average dealer email sessions have seen another drastic increase over the past 30 days (+102.0%). This insight has been consistent for weeks and begs a review of your dealership’s email traffic against this statistic. How do you stack up? Review your current email marketing strategy to make sure you’re following best practices and capitalizing on this opportunity.
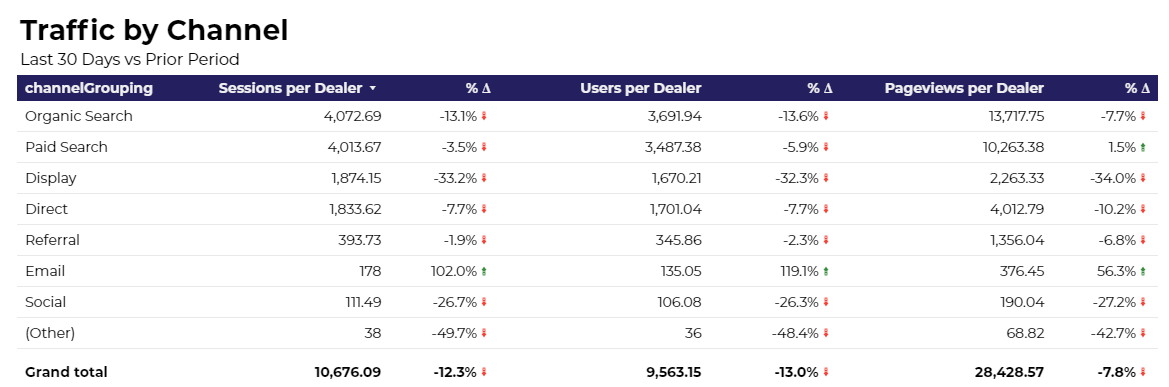
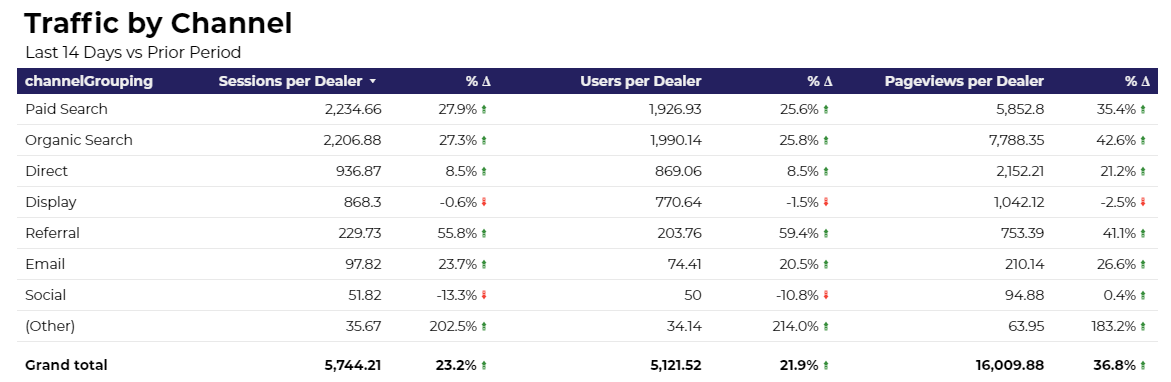
Looking at more recent changes over time, we’re seeing that paid and organic sessions (+27.9% and +27.3%), users (+25.6% and +25.8%), and pageviews (+35.4% and +42.6%) are up significantly over the last 14 days compared to previous. As customers refocus their attention on the industry, now is the time to start triple-checking that your inventory is current, and that your forms and chat functionality (if applicable) are working across your site.
DIGITAL ADVERTISING – PAID SEARCH TRENDS
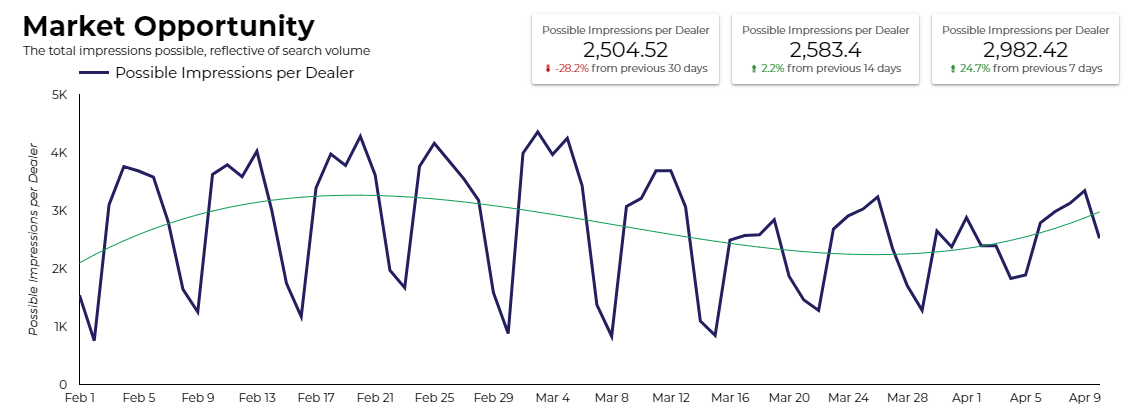
Now, let’s discuss digital advertising performance and trends. Total impressions possible per average dealer increased (+24.7%) over the past seven days which indicates a sizable increase in market opportunity over the last week. Yet again, April 9th proved to be a pivotal day and saw the highest number of possible impressions (3,341) since March 12th (3,686).
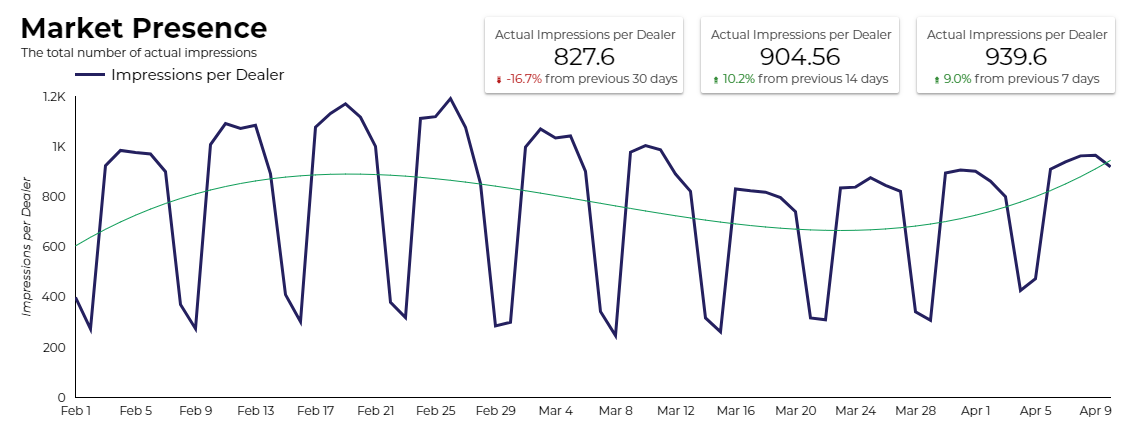
Additionally, the total actual impressions per average dealer has increased (+9.0%) over the last 7 days and has been up now for two weeks in a row. We’ll keep a close eye on this metric, now that we’re seeing a consistent positive trend.
While market metrics for digital advertising are showing positive signs, we’re not seeing conversions follow suit. April 6th saw the highest lead action conversion rate (11.9%) since March 26 (12.88%), but the average dealer lead action rate is at (10.21%) which is down (-2.1%) over the last 7 days.

While average dealer lead action cost is up (+13.6%) over the past 30 days, the lead action cost per dealer has finally steadied in the last week and actually dropped (-1.7%) in the last 7 days. Complementary to this, the average dealer cost-per-click (-1.0%) and average dealer click-through-rate (-4.2%) are down over the past 7 days.
Insights published April 6, 2020
The insights below were published on 4/6/20. Please check back for weekly updates. To get relevant industry performance metrics and helpful resources during this time, please visit our resource hub or subscribe below.
WEBSITE PERFORMANCE TRENDS
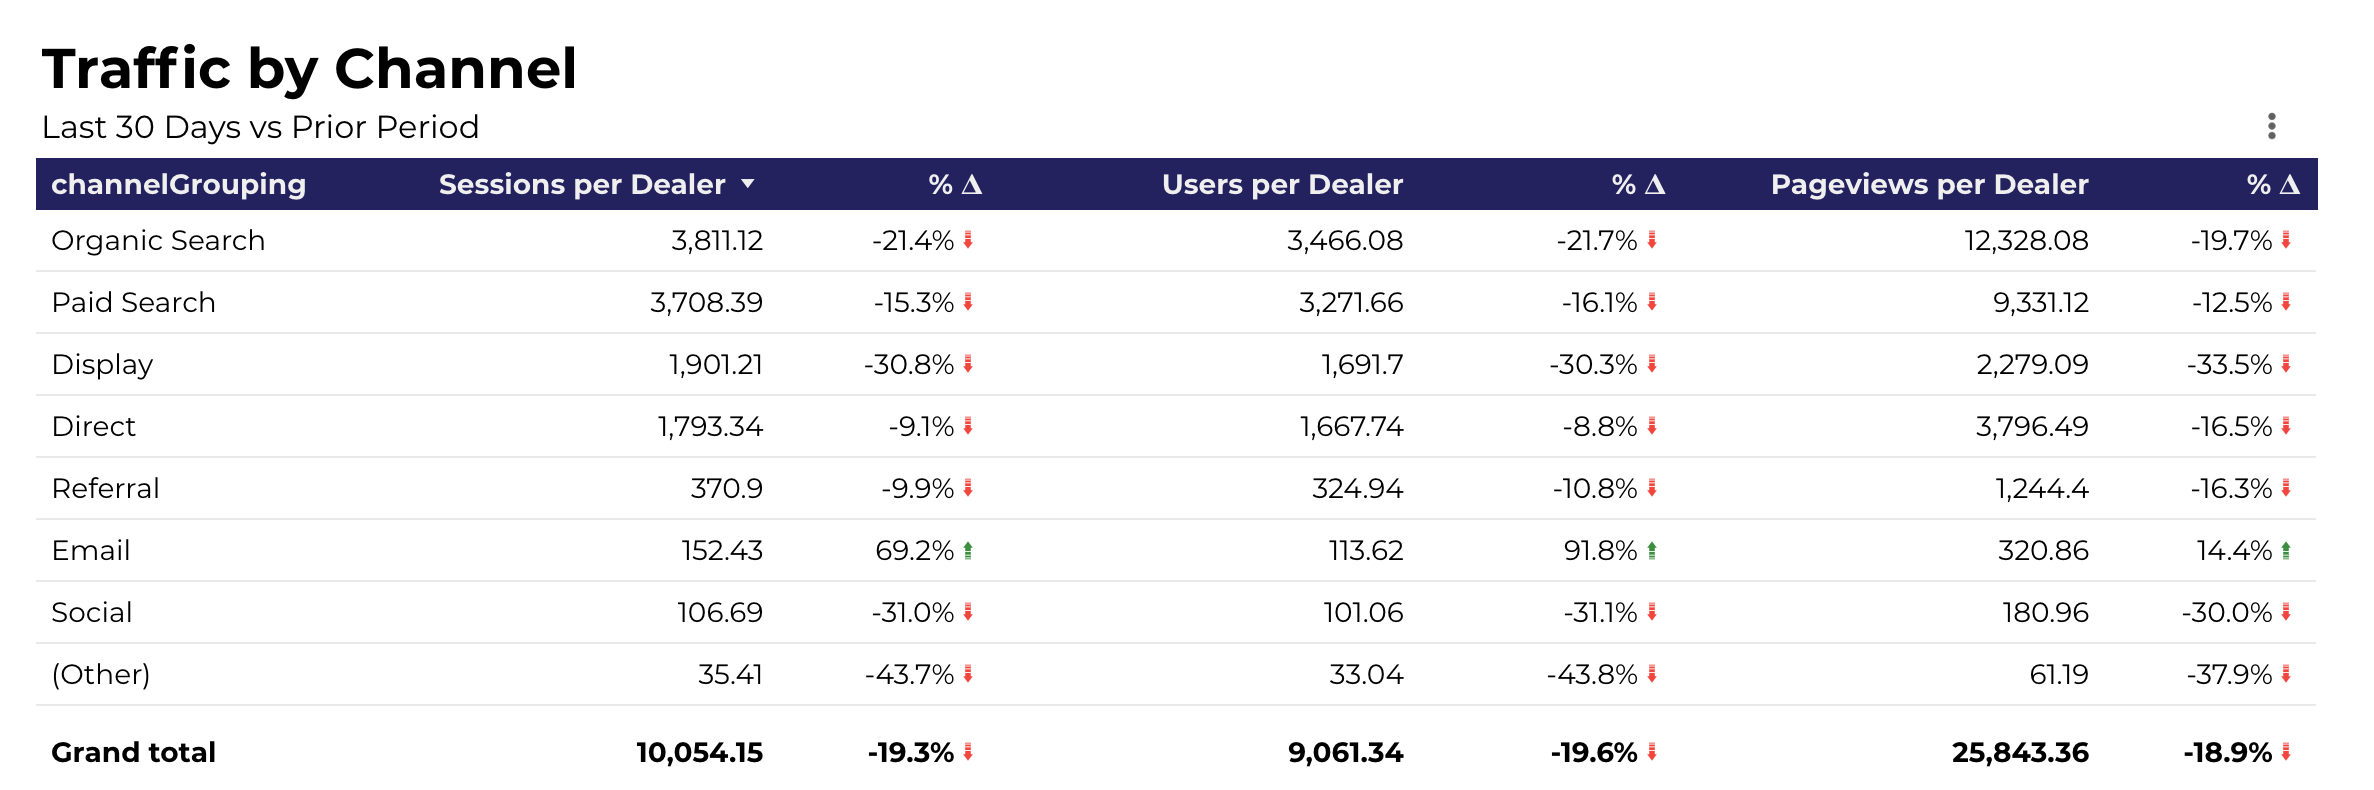
Overall, you can see that website traffic has declined in the back half of Q1. Over the past 30 days, website traffic has dropped (-19.3%) compared to the previous period.

On a positive note, Email traffic has swung in a completely different direction and is up (+69.2%) in the last 30 days. This confirms that email is a key channel for dealers at this time and staying on top of your email marketing is critical right now.
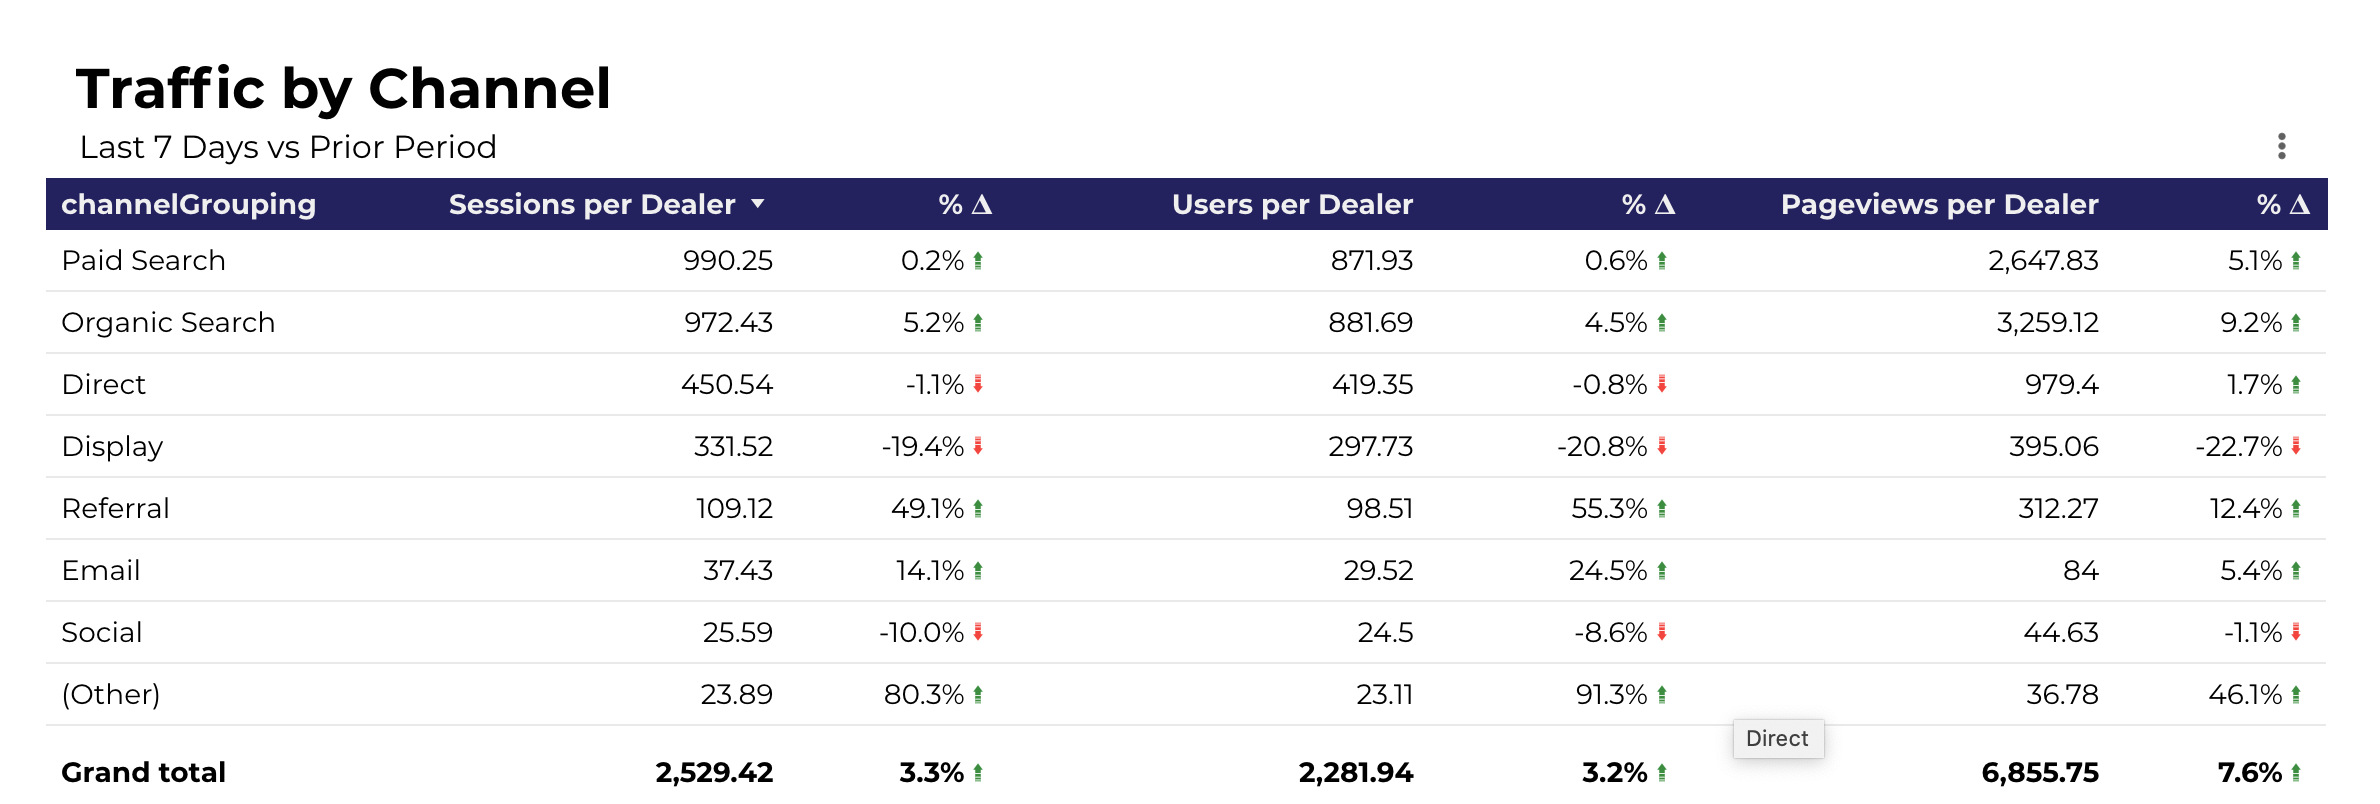
Piggybacking on the slight uptick we saw at the end of March, (+0.6%), the first days of April also saw dealer website traffic increase. Traffic is up (+3.3%) over the previous 7 days. Additionally, Paid search (+0.2%), Organic (+5.2%), Referral (+49.1%), and Email (+14.1%) have all seen positive lifts over the past 7 days.
DIGITAL ADVERTISING – PAID SEARCH TRENDS
Now to zoom in on paid search trends. In the last 7 days, we’ve seen possible ad impressions decline (-10.7%).

Meanwhile the average dealer’s ad impressions have increased (+5.2%). These two opposite metrics signal that there are less searches overall in the last 7 days, but dealers have been able to capitalize on those searches. In this last 7 days period, dealers have been able to show more ads than they have compared to the previous period. This is a win for dealers who are maintaining all, or even just some, of their digital advertising efforts right now.

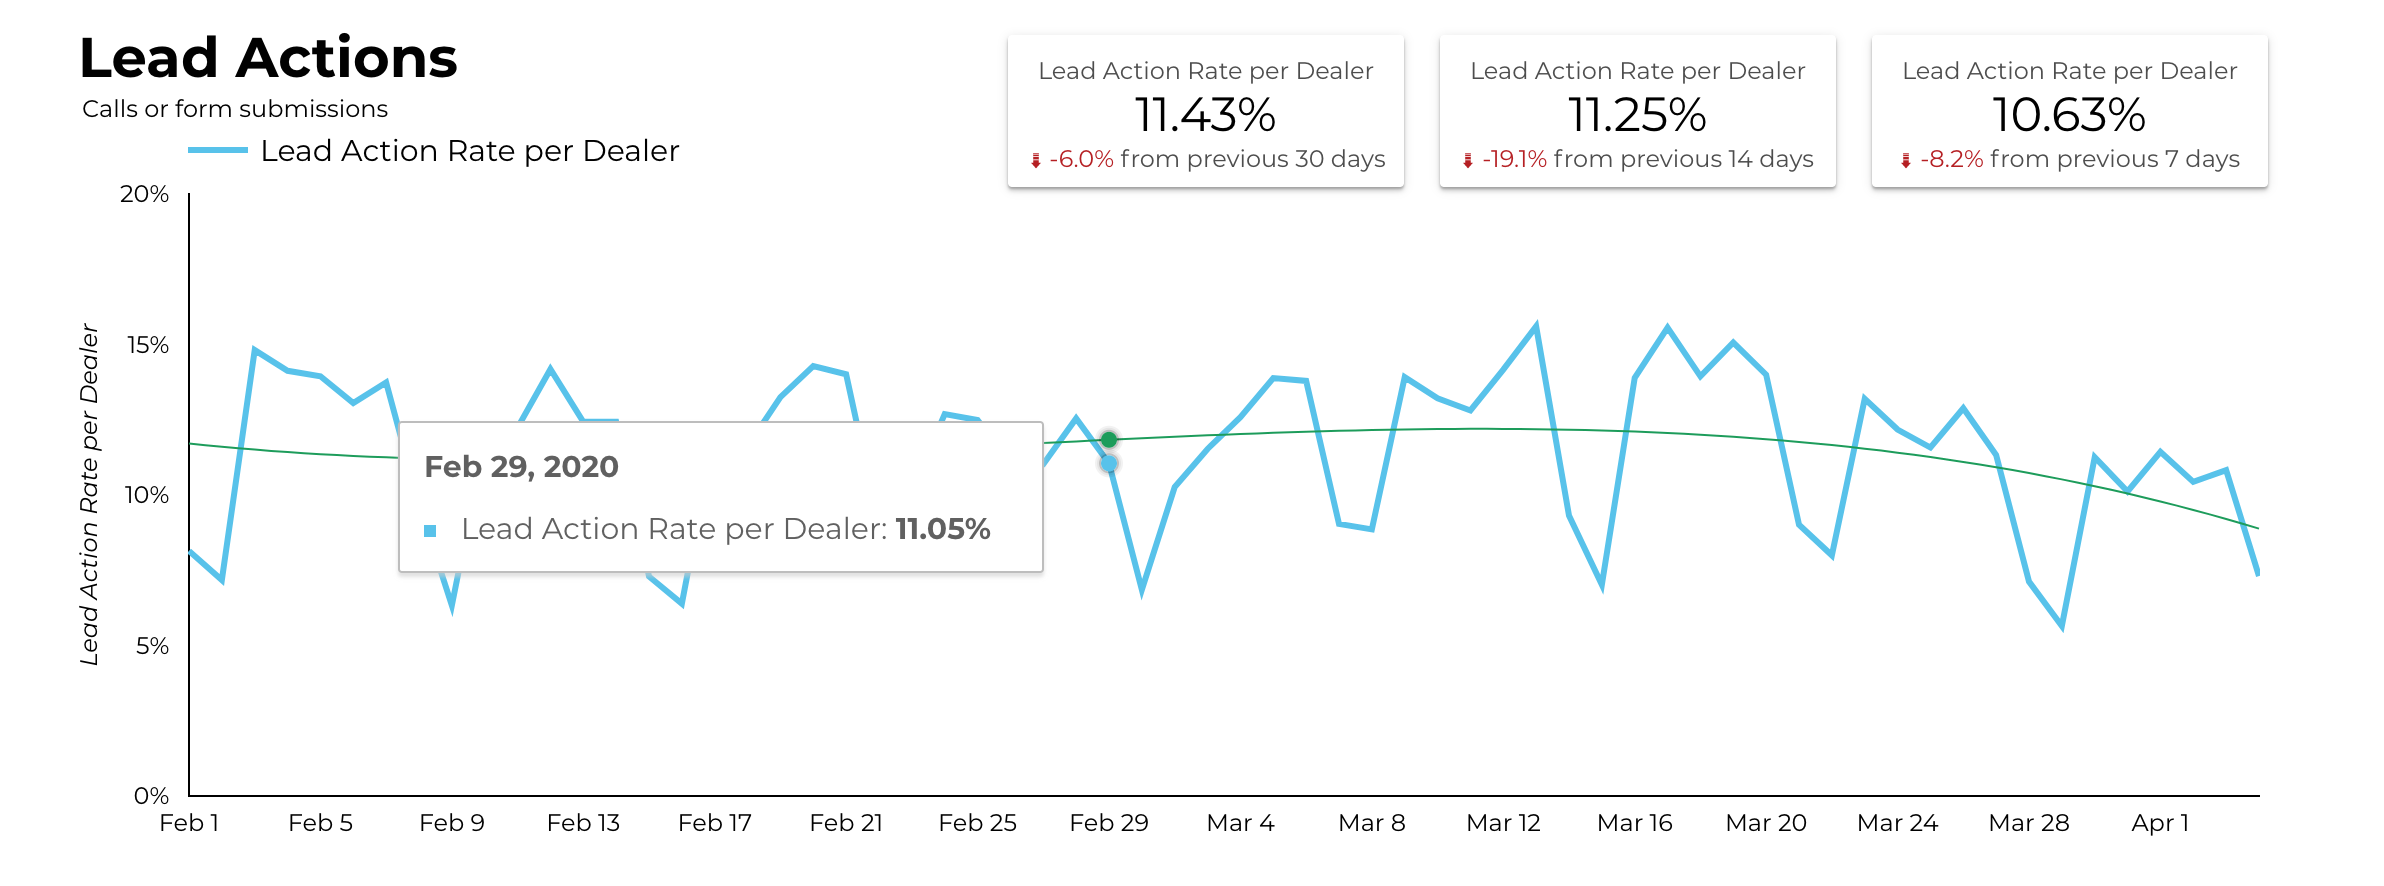
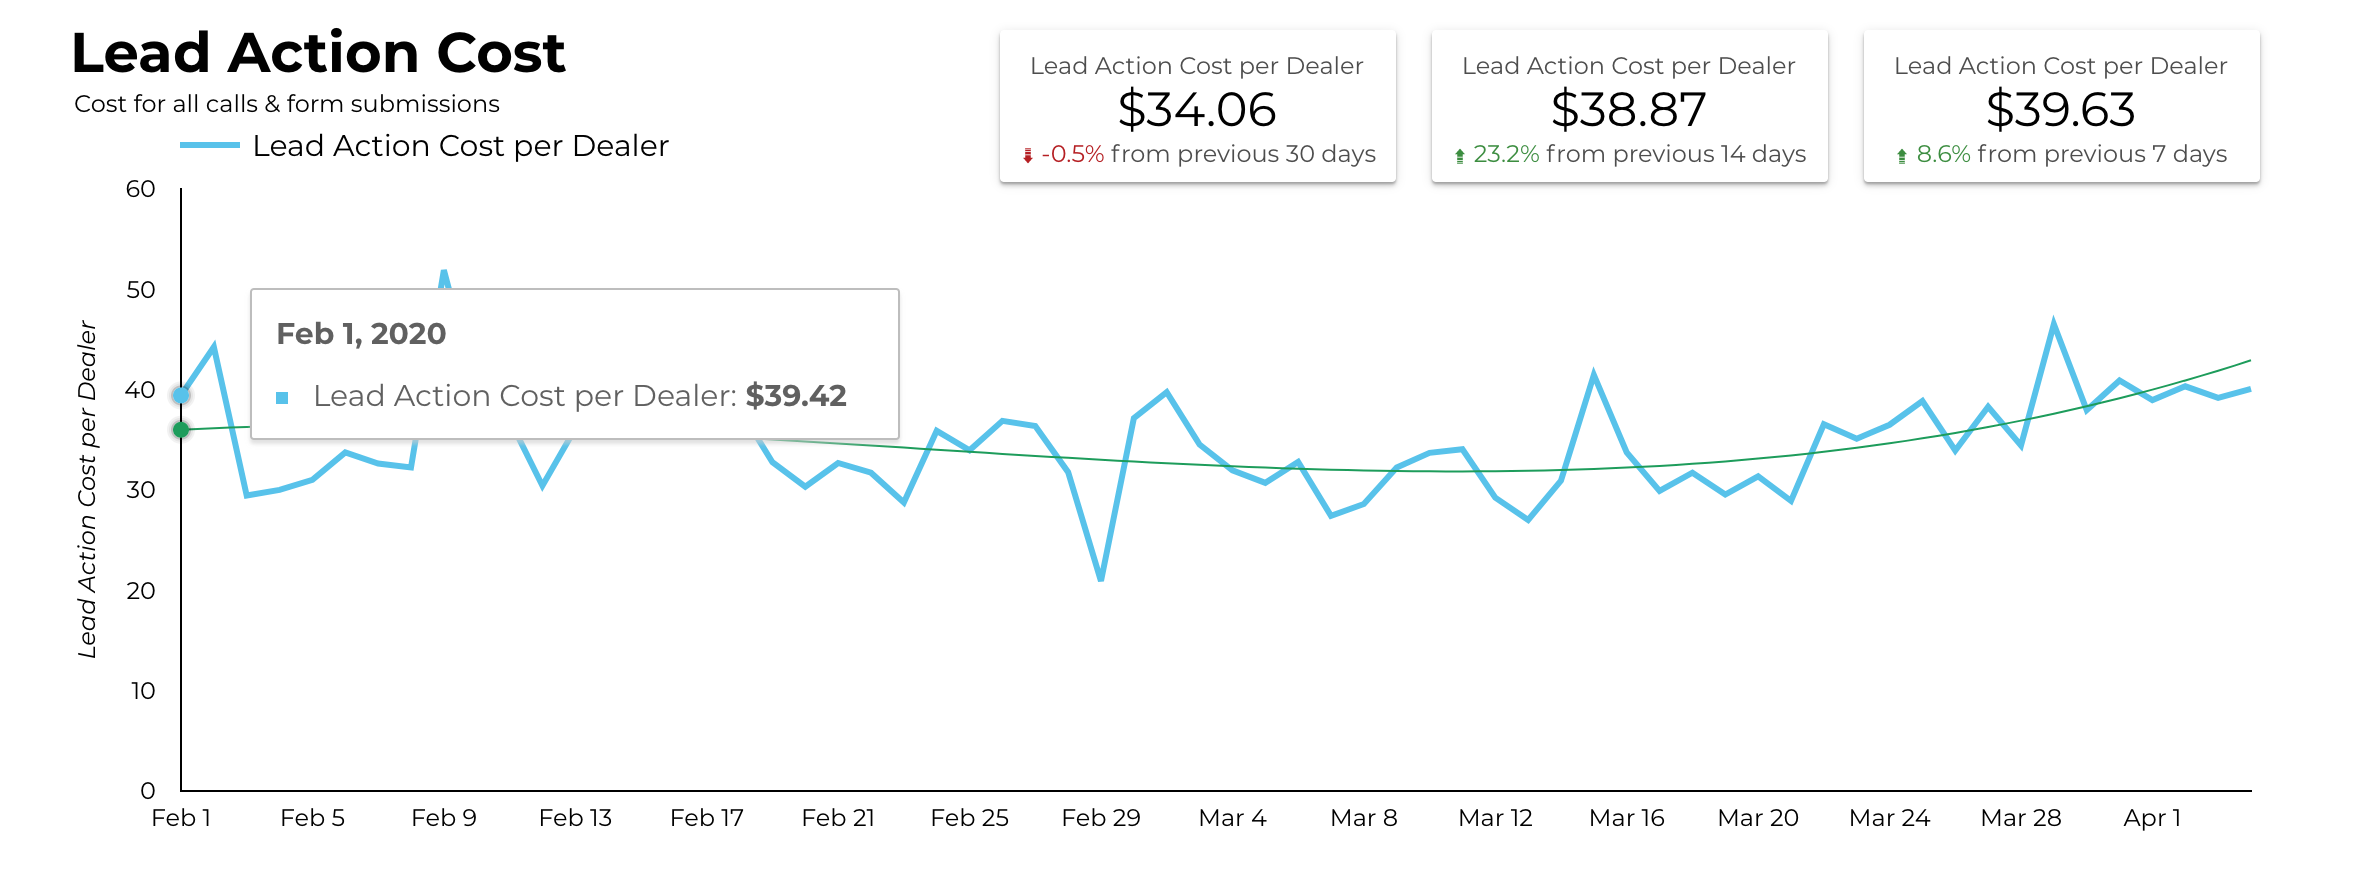
The lead action rate for the average dealer is at 11.43%, down (-6.0%) from the previous 30 days. We’re also seeing a week-over-week decline in lead action rate, potentially a trend towards research versus action at this time.
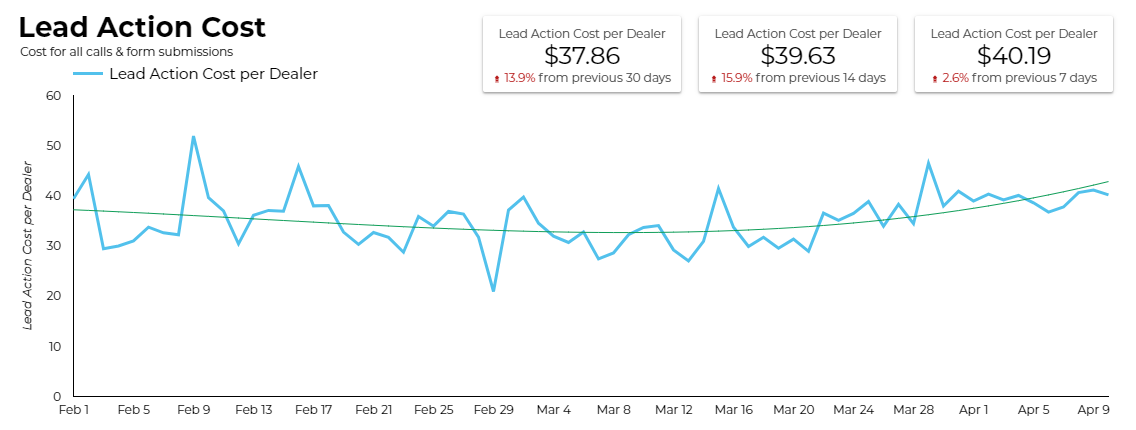
However, while we’re seeing declines in lead action rate for the average dealer, the cost per lead action has remained relatively constant at $34.06 per lead action, slightly down (-0.5%) over the last 30 days. More significant changes to cost have been starting to take effect over the last couple weeks, so we will continue to monitor this closely.
GOOGLE TRENDS
To understand how search behavior may be changing, use the following links to review common search terms in Google Trends:
About the Author
Adpearance is the digital marketing company obsessed with generating quality leads. Our solutions combine cutting-edge technology, premium tracking, and an expert team to transform business results.
Follow Us
Subscribe to our newsletter
Come on... You know you want to.
Related Posts
Subscribe to our newsletter
Get monthly newsletters with timely blogs and occasionally announcements for resources including in-depth reports, data-driven insights, and webinars.